Last month, we shared monthly employment data from the BLS. In this month’s Data Corner, we examine the National Trends In Disability Employment (nTIDE) and their work tracking employment for people with disabilities. We will also explore some educational data that shows some encouraging progress.
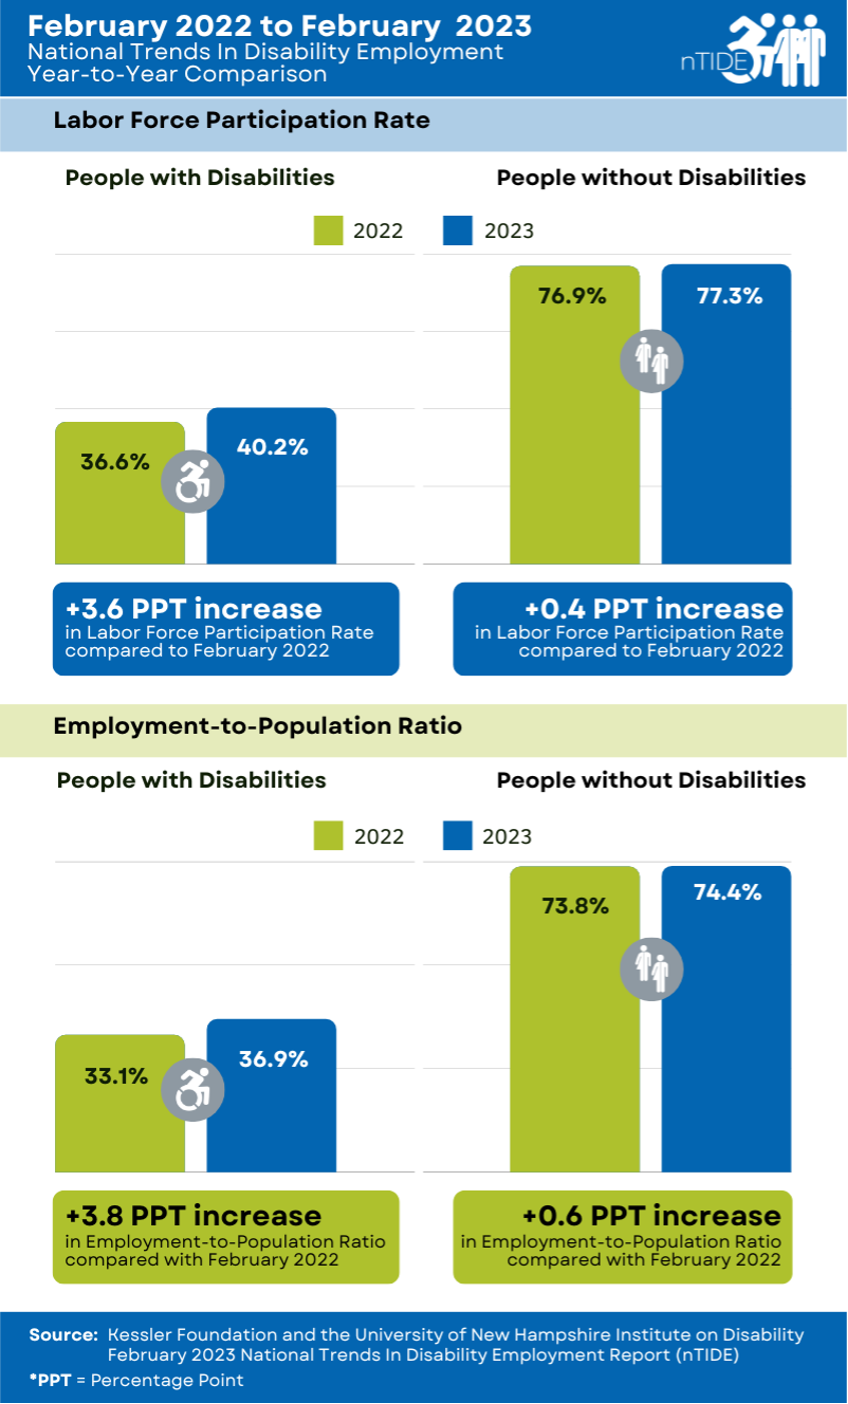 In February 2023, the labor force participation rate for people with disabilities rose to an all-time high of 40.2%, compared to 36.6% in February 2022. This is encouraging as we work towards closing the gap between workers with and without disabilities. Workers without disabilities experienced a smaller uptick in the labor force participation rate, which rose from 76.9% in February 2022 to 77.3% in February 2023.
Likewise, the employment-to-population ratio for people with disabilities rose from 33.1% in February 2022 to 36.9% in February 2023. For those without disabilities, the employment-to-population ratio increased from 73.8% to 74.4%.
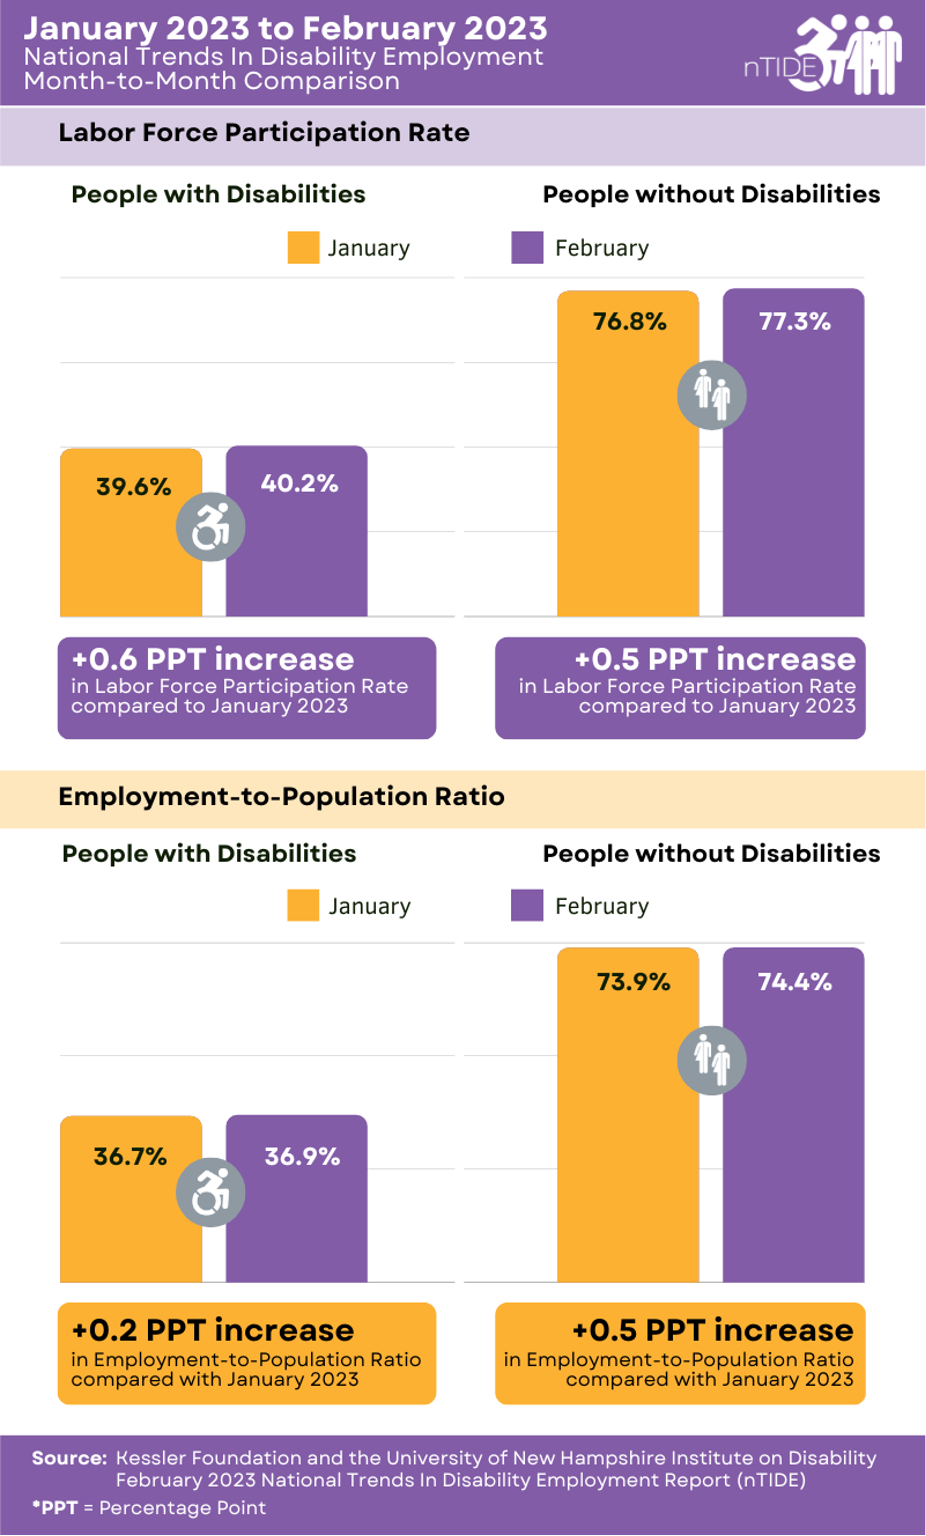 The month-to-month data also showed an increase in the labor force participation rate for people with disabilities from 39.6% in January 2023 to 40.2% in February 2023. For those without disabilities, there also was an uptick in the labor force participation rate rising to 77.3% in February 2023 from 76.8% in January 2023.
The month-to-month employment-to-population ratio for people with disabilities rose to 36.9% in February 2023 from 36.7% in January 2023. On the other hand, those without disability’s employment-to-population ratio increased from 73.9% in January 2023 to 74.4% in February 2023.
Although it is worth celebrating the record-high rates of disability employment, and that disabled people are joining the workforce at a higher rate than non-disabled people, our true goal is to achieve employment parity with the non-disabled workforce. Therefore, the importance of creating high-quality, sustainable jobs cannot be understated.
Education Statistics
New data released in December 2022 as part of the U.S. Department of Education’s National Center for Education Statistics report shows that high school graduation rates for people with disabilities have increased by 2.4 percent: from 68.2% in 2018-19 to 70.6% in 2019-20. Although graduation rates continue to climb nationwide, results vary from state to state. It is also important to note that the total U.S. high school graduation rate is 86.5%, which means that there remains a 15.9% gap between disabled students and the population at large.
Like with employment statistics, it is worth celebrating the increase in high school graduation rates for students with disabilities nationally, but our goal is to achieve parity with the population at large. To do that, we must dive deeper into the reasons for the gaps, and base our approaches on the needs of each student.